
Sound familiar?
The board asks — and there is no answer: a folder of plans, but no numbers.
A quarter later the plans are stale, exercises stopped, and nobody noticed.
Degrading protection becomes visible only when something breaks and costs money.
The cost of not seeing
A typical cost of one day down for a mid-size business — most companies never calculated theirs.
The share of small businesses that never resume operations after a major disruption (FEMA).
Actual recovery time is often several times the target — discovered during the outage.
Blindness is not cured by another thick report. You need an instrument that shows the state at all times.
What the dashboard looks like
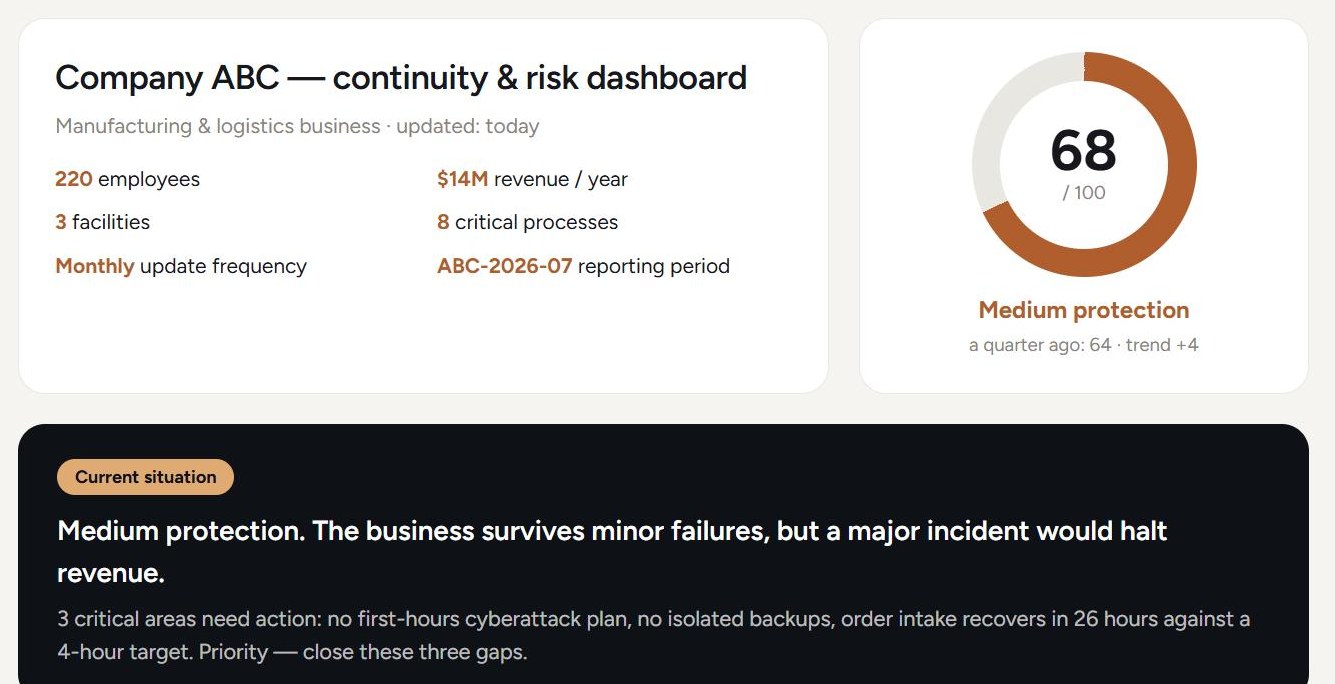
This is the top of the working screen — the overall resilience index and the business parameters. It is a fragment shown for understanding, not the whole dashboard: below it come critical processes with traffic lights, single points of failure, plan status and quarterly trends.
What you will see on the dashboard
Resilience index 0-100 with its trend: one number for the board conversation.
Critical processes with traffic lights: readiness, RTO/RPO, owners.
Single points of failure: one person, one supplier, one server, one AI service.
Financial exposure: cost of downtime and the recovery cushion.
BCP/DRP coverage, review dates, when exercises ran and what they revealed.
Quarterly trends: where things improved and where degradation started.
Who needs it and when
See business resilience the way you see revenue — without reading the plans.
One screen instead of a quarterly «everything is fine» report.
A single picture instead of a dozen spreadsheets; arguments for the budget.
Show maturity to banks, exchanges, tenders and insurers — with numbers.
Especially timely before a tender or a regulator review, after a recent incident, when the insurer starts asking questions — or right after a BCM project, to keep the system alive.
Start in days, not months
When the appetite comes, we connect your systems directly (the Integration level) and the numbers update without manual input.
Product levels
Excel workbook with the methodology, the engine, setup for your structure, coordinator training, first dashboard. Live in 2 weeks.
Connection to your data mart or systems (BI, ERP, ITSM): structure design, mapping, data quality rules. Delivered together with your IT team.
We collect the updates, rebuild the dashboard and send a short expert commentary: what changed and what to watch.
Pricing depends on scale and level — we will discuss it at the demo, once we map the product to your business.
How the dashboard works
No heavy IT system involved: the dashboard is a single HTML file built by a small Python engine. The engine runs entirely inside your perimeter — on the coordinator's laptop, a corporate server or your private cloud. Data never leaves the company.
Start in days, not months. At the first level the data source is an Excel workbook we ship with the dashboard: one sheet is a data form with pre-selected metrics, another is guidance on what to fill in, how and how often. Our methodology is already inside the file, so you skip months of deciding «what to measure» — the coordinator starts filling the form on day one.
Integration level — when the appetite comes. If the company has a data mart or source systems (BI, ERP, ITSM), the engine connects to them and collects the numbers automatically. Most of the time no new data is needed — we help reuse what you already have: we design the mart structure, the mapping and the data quality rules, while your IT team does the connection.
History and trends. On every rebuild the engine stores a dated snapshot in a lightweight embedded database (SQLite) next to itself. So the dashboard shows not only the current state but the dynamics: what improved over the quarter and where degradation started.
Support — optional. You can run the dashboard fully on your own, or subscribe to a monthly service: we collect the updates, rebuild the dashboard and send a short commentary on what changed.
Why this is not «just another BI report»
- Methodology inside. A BI team spends months deciding what to measure. Here the continuity metrics are already selected, defined and linked — fill from day one.
- No IT project needed. The start requires no integrations, servers or procurement: Excel plus a light engine inside your perimeter.
- History and trends out of the box. Every rebuild stores a snapshot: you see dynamics, not just a snapshot of today.
- It stays alive after the project. Scheduled updates and traffic lights keep the continuity system from quietly dying.
We will show the dashboard on your industry's example
30 minutes online, no strings attached: we walk through a live dashboard, map the metrics to your business and honestly tell you whether it will fly. Only a name and a contact needed.
Book a demoReady to discuss the project right away? Say so in the request comment — we will start with the details.
FAQ
No. The engine and the data live entirely inside your perimeter — on your computer, server or private cloud. Not a single number goes outside.
With the Excel workbook: the methodology inside tells you what to collect. If there is no baseline data at all, we will gather it together in an express assessment — part of the Start level.
Your coordinator — 1-2 hours a month following the guidance. Or subscribe to the monthly service and we will handle it.
Usually 2 weeks from the start: setup, form filling, first build and a results review.
No. It is a management tool and a methodology — honestly, with no inflated promises.
Request a demo or a quote
Leave your name and work email. We reply within one business day and propose the next step.
Prefer messaging? Telegram · info@risk-place.ru